
If you haven’t looked at gold and silver prices for a while, you could be forgiven for wondering what on earth happened. The past nine months have been extraordinary, with gold hitting record highs, silver making even bigger moves and both experiencing some fairly spectacular falls along the way.
Rather than trying to predict where they’re going next, let’s look at what has actually happened and why.
Gold started the year with a bang
Gold was already coming off a very strong 2025 when 2026 began, but January took things to another level, with gold rising around 14% in US dollar terms. Then August delivered another 13.3% rise, making it gold’s third strongest month in 25 years.
For Australians, the exchange rate adds another layer. Gold finished August at A$6,372 an ounce, although there have been some sizeable falls and recoveries along the way.
Silver has been even wilder
While gold tends to get most of the attention, silver has arguably been the more interesting story. In the 12 months to the end of March 2026, the Australian silver price rose from around A$54.55 to A$105.84 an ounce, an extraordinary increase of 94% in a year.
According to Ainslie Bullion, that was the largest one-year move for silver in its 26 years of Australian data. Since then, silver has pulled back sharply and then recovered again, recently trading around US$66 after approaching US$70 in late August.
Why has all this been happening?
There isn’t one neat answer. Gold has been influenced by concerns about government debt, currencies, inflation and geopolitical uncertainty, while changing expectations around interest rates have also contributed to some of the big swings.
Investment demand has been enormous at times. In August alone, US$18 billion flowed into gold-backed ETFs globally, helping take total holdings to a record 4,189 tonnes.
Silver has many of the same precious-metal influences, but it also has significant industrial demand from solar panels, electronics, vehicles and electrical infrastructure. At the same time, demand has been exceeding supply for years, with 2026 forecast to be the sixth consecutive annual silver market deficit.
That doesn’t mean industrial demand only goes one way. As silver becomes more expensive, manufacturers look for ways to use less of it. Solar manufacturers are already doing exactly that, and industrial silver consumption is forecast to fall around 3% this year.
What about the bigger picture?
It’s also worth stepping back from the last nine months. Ainslie Wealth has now updated its comparison of gold, silver, Australian property, shares and cash, and the latest graph makes for interesting reading.
From 2000 to March 2025, gold returned 962%, with an average annual return of 10.9%. Silver returned 557%, averaging 10.5% a year. That compares with 455% for Australian houses including rental income, 334% for the ASX All Ords including reinvested dividends, and 146.4% for cash including compounded interest.
Perhaps the biggest change from the previous graph is silver. When we originally wrote this article, the available comparison only ran to 2023 and we wondered whether silver’s subsequent rise might have pushed it past Australian property. We now have the answer. It has.
Of course, this doesn’t mean gold or silver will continue to outperform, and the journey certainly hasn’t been smooth. The graph shows some substantial falls along the way, particularly for silver. But it does provide some useful perspective when we’re talking about long-term investing rather than what an asset has done over the past few months.
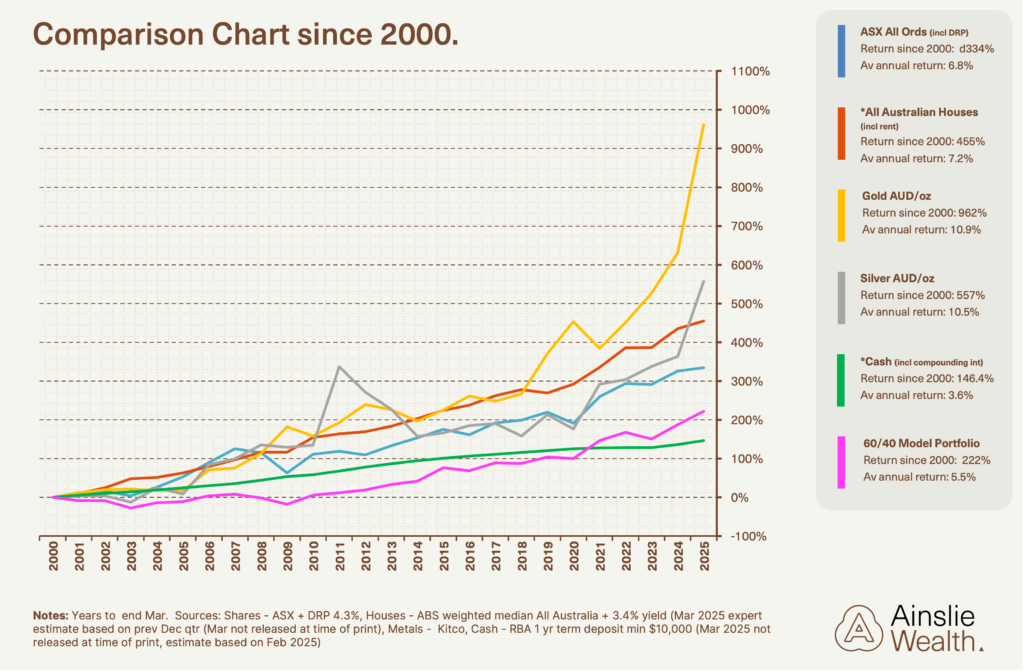
Graph courtesy of Ainslie Wealth. Returns shown are from 2000 to March 2025. Past performance is not an indication of future performance. Read more about this graph here.
Have you missed the boat?
That’s probably the question many people are asking, particularly if they’ve watched gold and silver rise without owning either. We think there’s a more useful question: why are you considering it now?
If you weren’t interested in gold when it was considerably cheaper but suddenly want it after a huge run, has something changed in your investment strategy, or has the rising price simply caught your attention? The same applies in reverse. If you already own bullion and the price falls sharply, has the reason you own it changed, or has only the price changed?
For an SMSF, that’s particularly important because the investment timeframe may be 10, 20 or 30 years. What gold or silver does next month is probably far less important than why the fund owns it in the first place, how much it owns and how that investment fits within its overall strategy.
Gold and silver have had an extraordinary nine months, and there are genuine reasons behind much of what we’ve seen. Where prices go from here is something nobody can tell you with certainty, which is why understanding why you own an investment in the first place is far more useful than trying to guess what its price will be next month.
This article contains general information only and does not constitute financial, tax or investment advice. Past performance is not an indication of future performance.